
Playbooks
Why Tableau is better than Excel: and why using Tableau with ScreenCloud Dashboards is even better than that
“Answer questions at the speed of thought”, so says Tableau. Does this highlight it – and other BI software like Grafana and Splunk – as being the epitome of productivity? Probably yes, actually.

It’s no secret; ScreenCloud loves business intelligence software. It’s the bread to our secure Dashboard butter. But we loved it even before we figured out how to securely show business-sensitive data up on a digital screen – because we use it ourselves.
In fact, this was the inspiration for ScreenCloud Dashboards. That, and numerous requests from our customers wanting to know how they could ensure the safety of their data while sharing it across multiple screens (and how to scale this up without the need for complicated, time-consuming and expensive hardware).
We’ve discussed the importance of secure signage software, and the technicalities of it in our whitepaper, but the real beauty of it is this: ScreenCloud Dashboards removes the need for specialist IT hardware. Couple that with an easy-to-manage business intelligence software like Tableau (or Grafana or Microsoft BI for that matter), and you can wave goodbye to squinting at Excel spreadsheets while trying to identify patterns in the data.
What can Tableau do (that Excel can’t)?
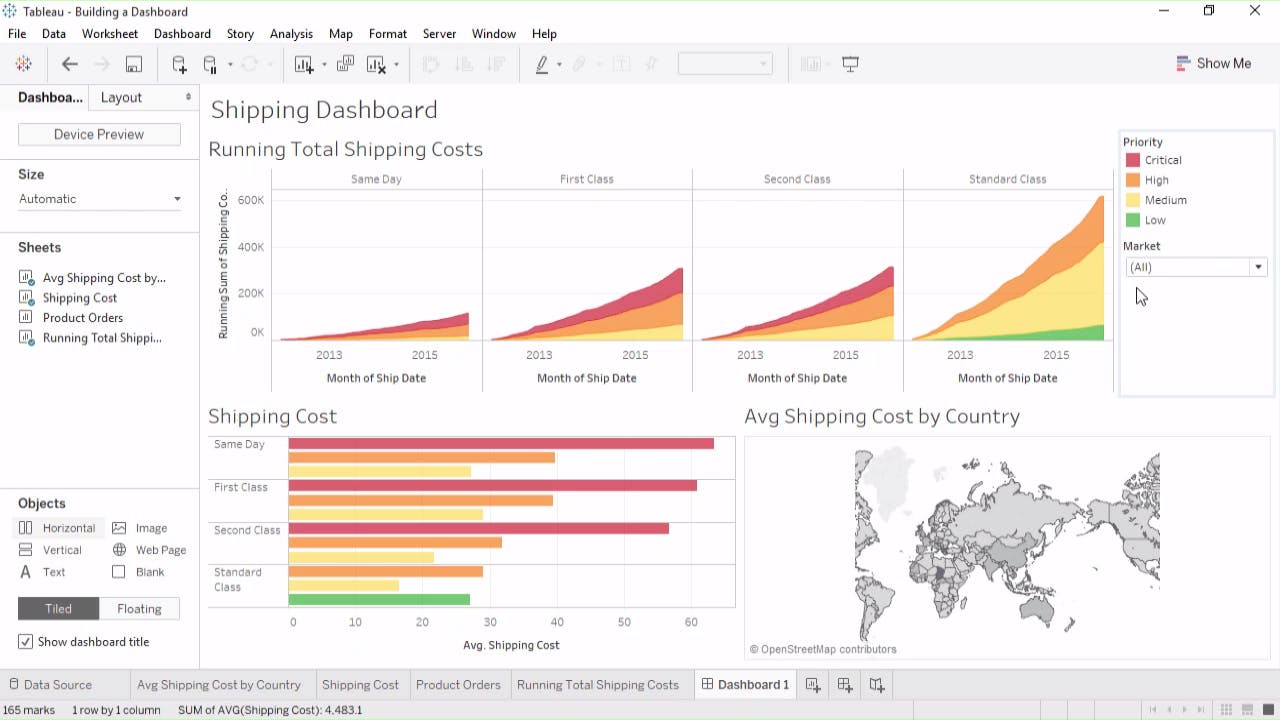
Tableau visualizes your data. Sounds simple. But sometimes the most powerful things are.
It also allows you to sort, highlight, filter and drill down into your data on an intuitive and interactive dashboard. Lay out your dashboard just right, and at a glance you can identify opportunities, change tack and discover the root cause of potential issues.
Some of our favorite Tableau features include:
Clear analytics:
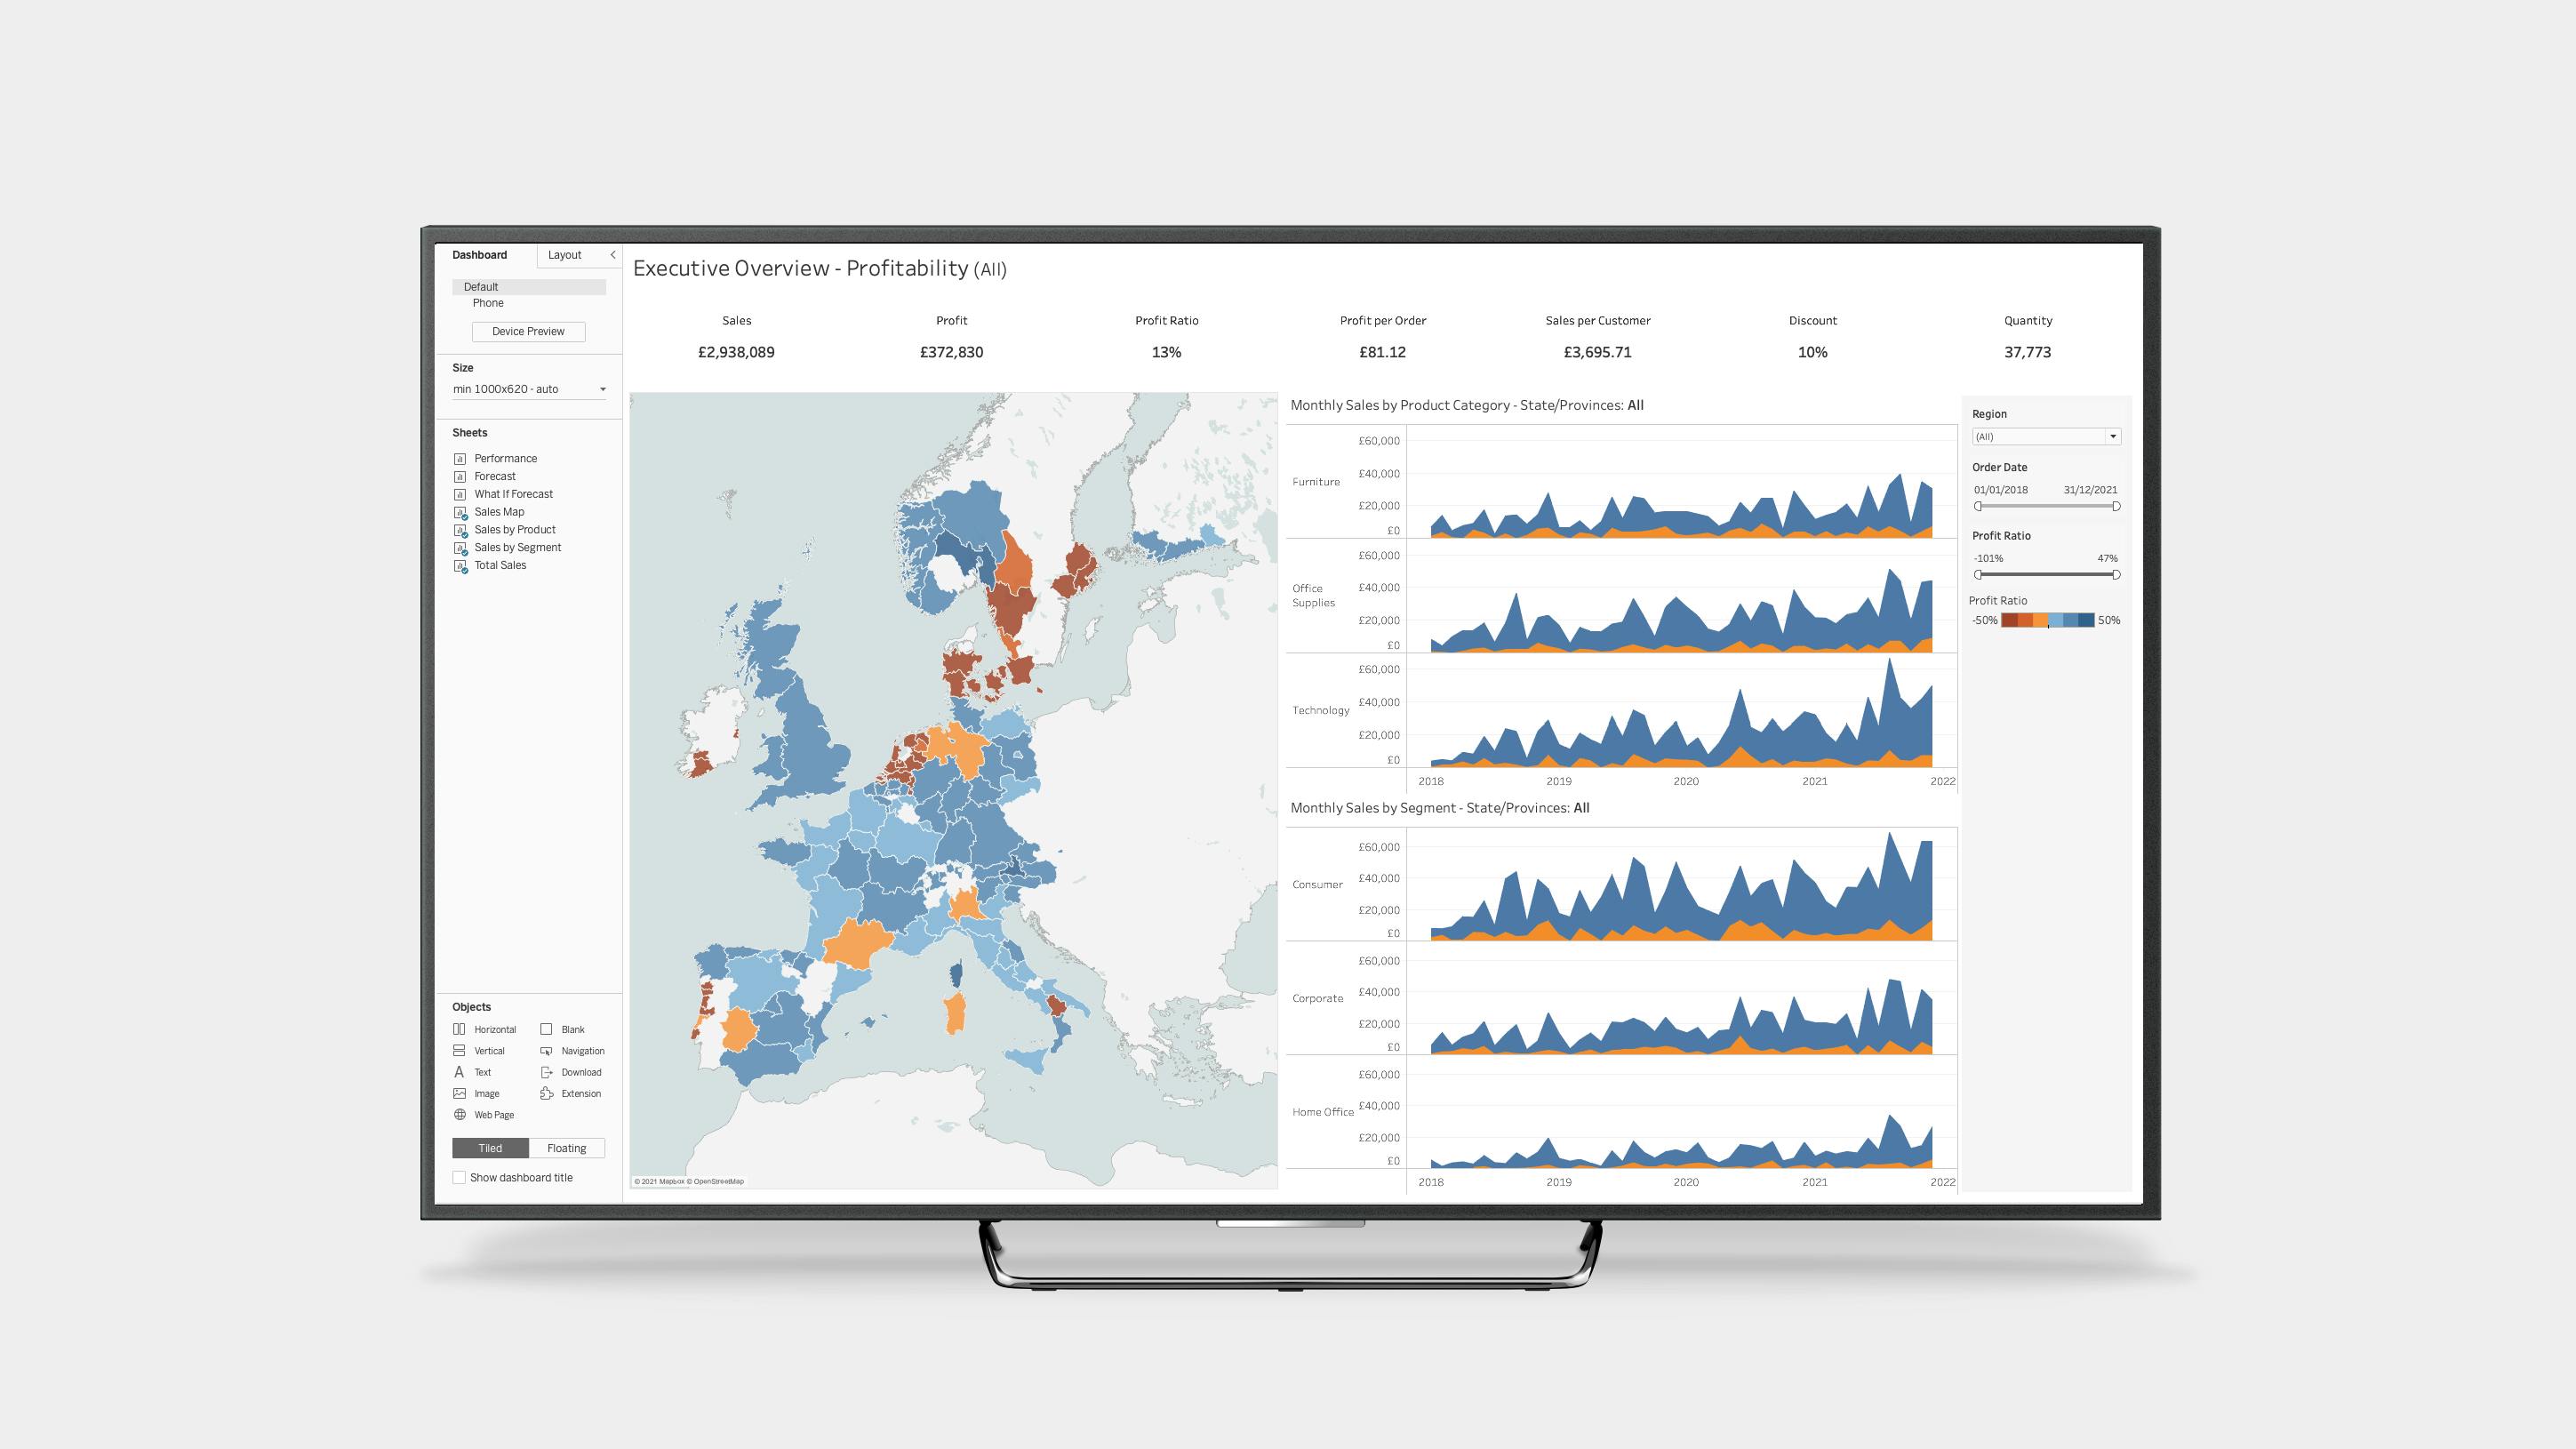
Tableau dashboards will connect with and visualize your data in elements like maps, graphs and charts. This helps you analyze massive amounts of information while also fighting “data fatigue”.
Intuitive dashboard management:
You don’t need to be a data analyst or even an IT specialist in order to reap the benefits of Tableau. It’s all drag and drop. Create data clusters by dragging the Cluster icon into your data, choose colors and set your variables. This makes it easy to identify trends and outliers.
See all of your data:
When analyzing data throughout a business, it is likely that there are multiple data sources at play. Tableau allows you to mix data from different sources – like Cloud databases, Hadoop and Excel – into one clear view.
Updates automatically:
The most effective data-driven decisions are those that can be made instantly. By having a live connection to your data, you can define and schedule when your data refreshes allowing for reactive action.
Best practices when creating a Tableau dashboard
- Know your purpose
Before creating your Tableau dashboard, set your KPIs. What is your dashboard trying to achieve? What insights are most important to your team? Who will actually be looking at this dashboard, and why should they? - Wireframe your dashboard
Once you have set the purpose for your dashboard you can figure out what data you need to pull, and how to visualize it. Build clarity with common themes and insights on your dashboards, and make your most important data the most prominent. - Test functionality
After you’ve built your dashboard, test it. How quickly can data-driven decisions be made from the data that you’re showing? How easy is it to glance and analyze? Don’t overload your dashboard with unnecessary data just because you have it. Keep it simple and to the point. Practice with data sets until you find the right combination. - Keep it secure
Think of your data like piles of cash; it’s highly desirable and prone to theft, so you want to limit access to it. Keeping that data safe while sharing it on “public” screens has been – historically – a tech-heavy and time-consuming process with numerous security flaws. ScreenCloud’s innovative approach to secure Dashboards can show this business-critical data to everyone that needs to see it, while keeping it totally secure with high-security remote screen-sharing.
Best practices for using Tableau and ScreenCloud Dashboards
- Allow incognito mode
Your browser stores information in Cookies and Local Storage; it allows you to automatically log into websites, remember items you've looked at recently, and even keep your theme preferences. All this makes your browsing experience much simpler.
The service ScreenCloud has created to display your content relies heavily on your journey having been recorded on a clean slate. So, rather than asking you to delete all your browsing history for a particular site, you can simply allow the ScreenCloud Dashboard Recorder to run in incognito mode. - Service account
We've gone the extra mile to make sure that all your sensitive data is completely secure. As an extra precaution, however, we highly recommend using a 'least privileged' service account when setting up your dashboards. - Start at the end
It is often the case that you can navigate directly to your target dashboard's URL. This will ask you to log in, and you’ll subsequently be redirected back to your destination. This is both the quickest and most reliable journey you can make in ScreenCloud Dashboards as it cuts out needless actions. - Search
Many dashboard providers offer search capabilities. Instead of clicking through multiple menus, it is quicker and more reliable to search for exactly the content you want to display. We recommend typing in the full name of the content you're hoping to display, as partial search terms may return more items.
Check our detailed Dashboards set up guide for more information.
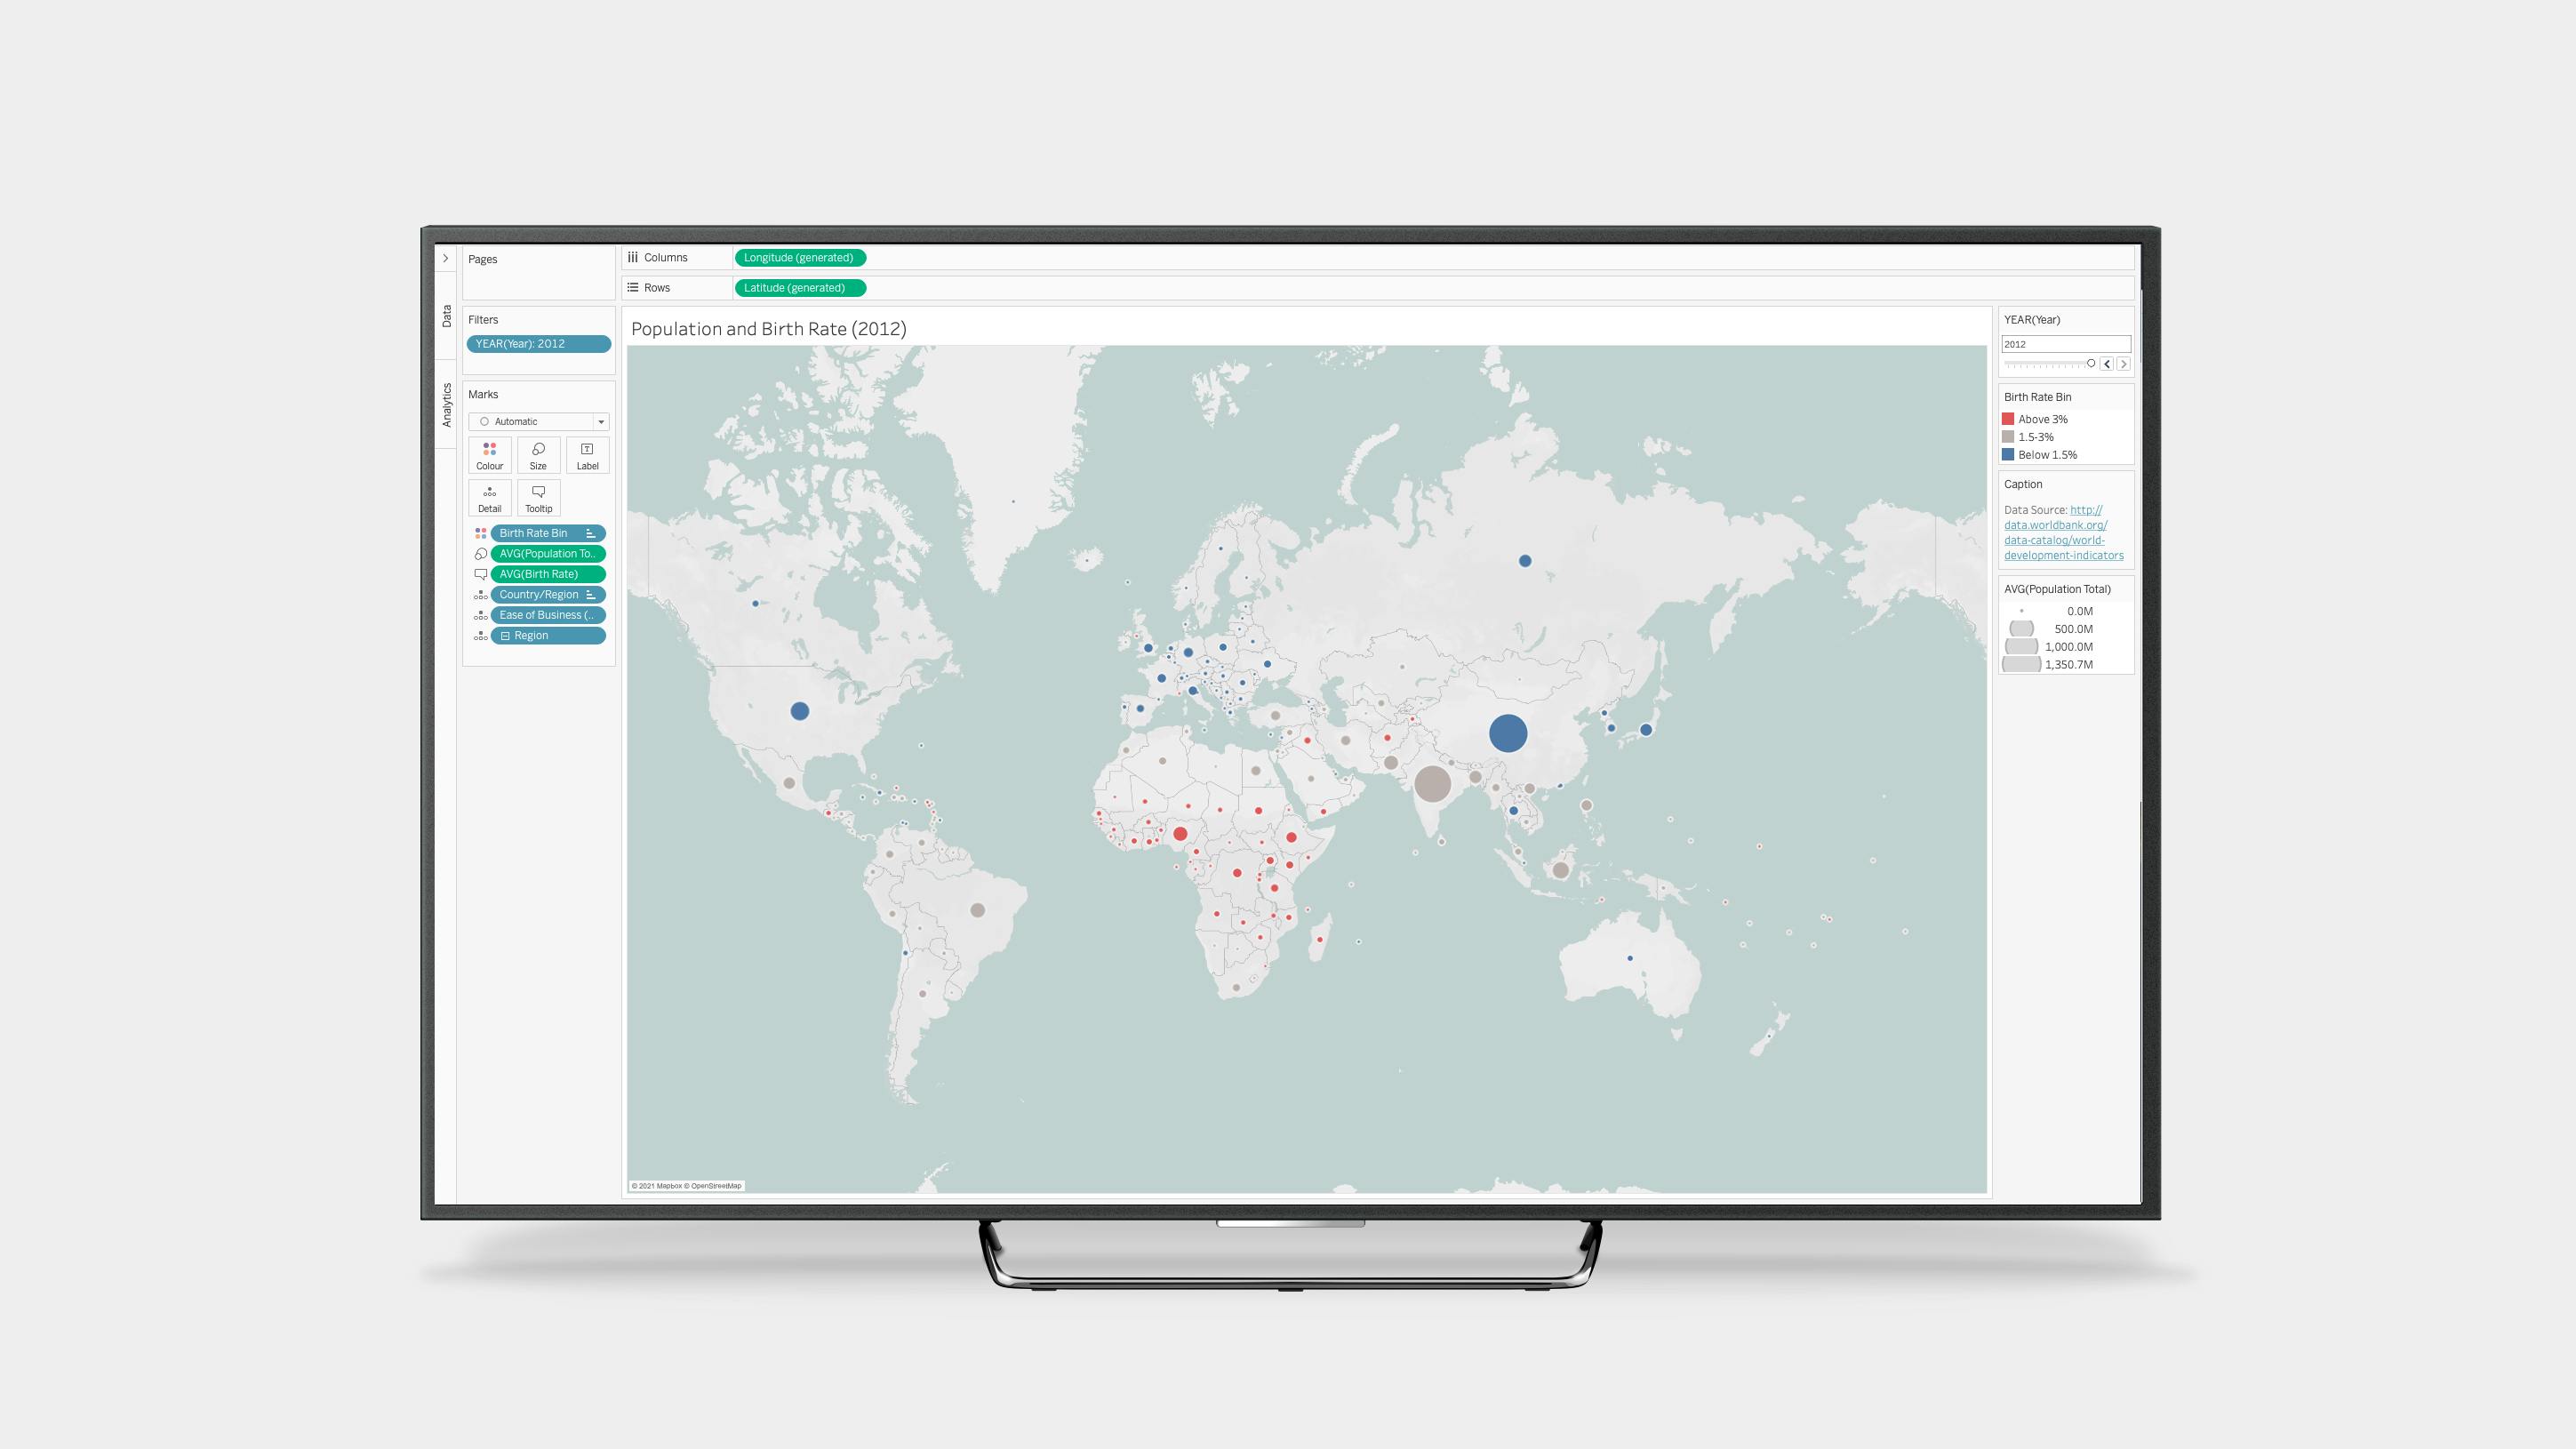
Tableau dashboard examples
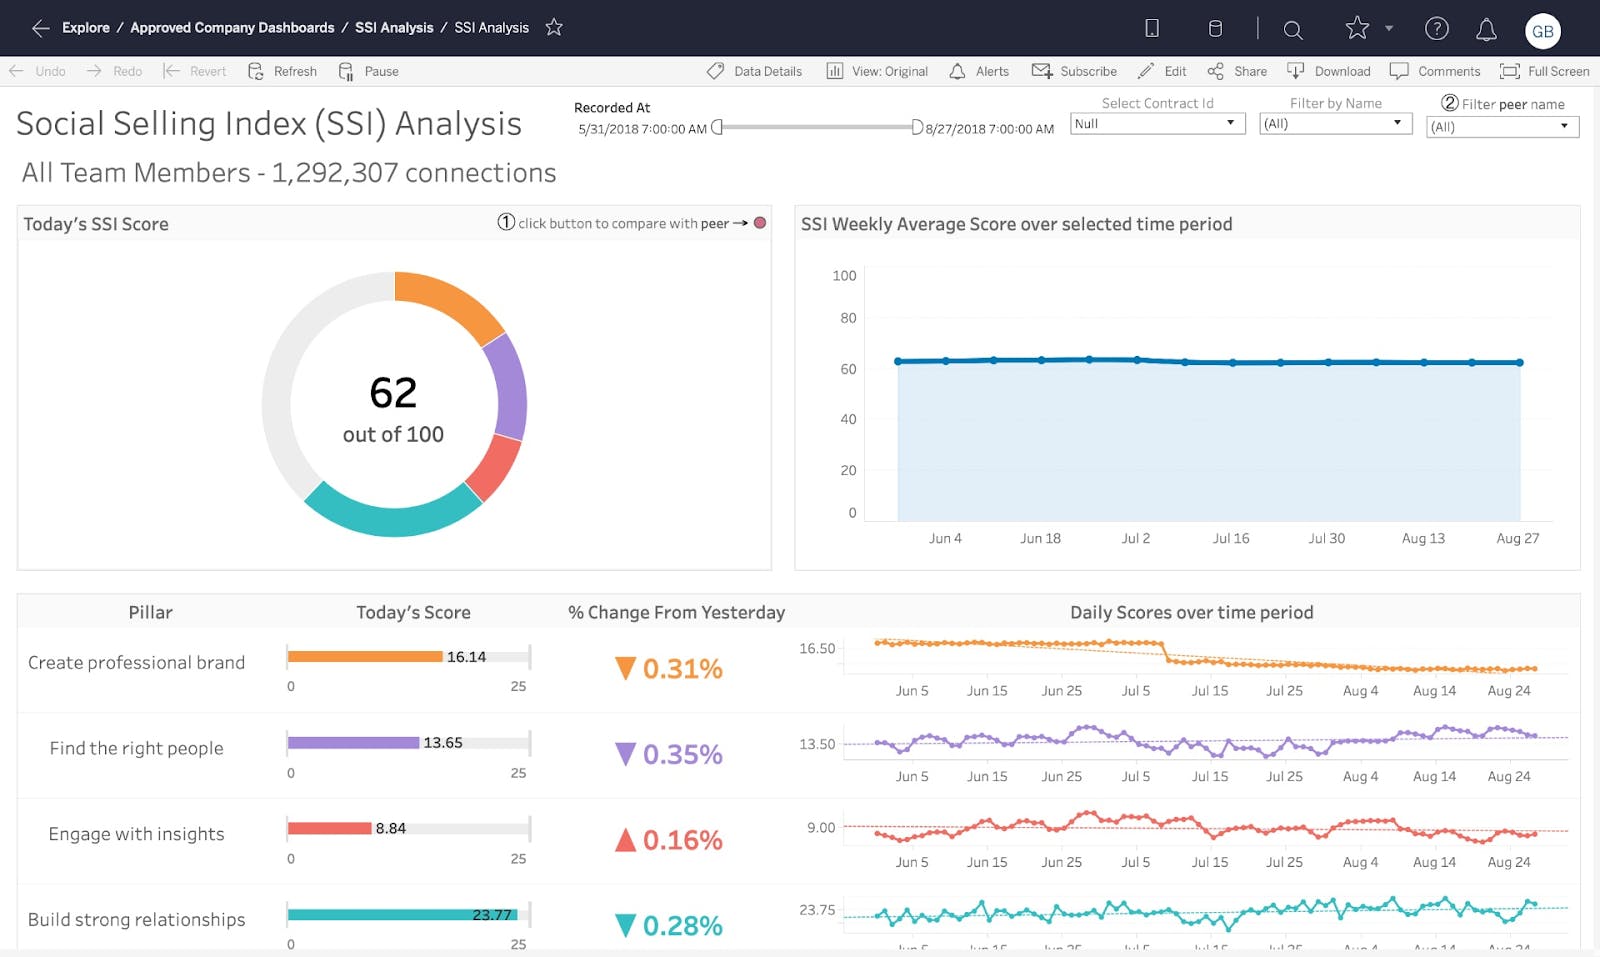
Social Selling Index Analysis
Measure your capability when selling a brand or product via social channels. By seeing data visualized in this manner you can measure your customer engagement with your SSI activities, and make effective data-driven decisions to boost your social sales performance.
Account Tracking
Pull in a variety of mixed data to see the whole picture when tracking the success of your accounts. Clearly identify quick wins, or spot at-risk opportunities.
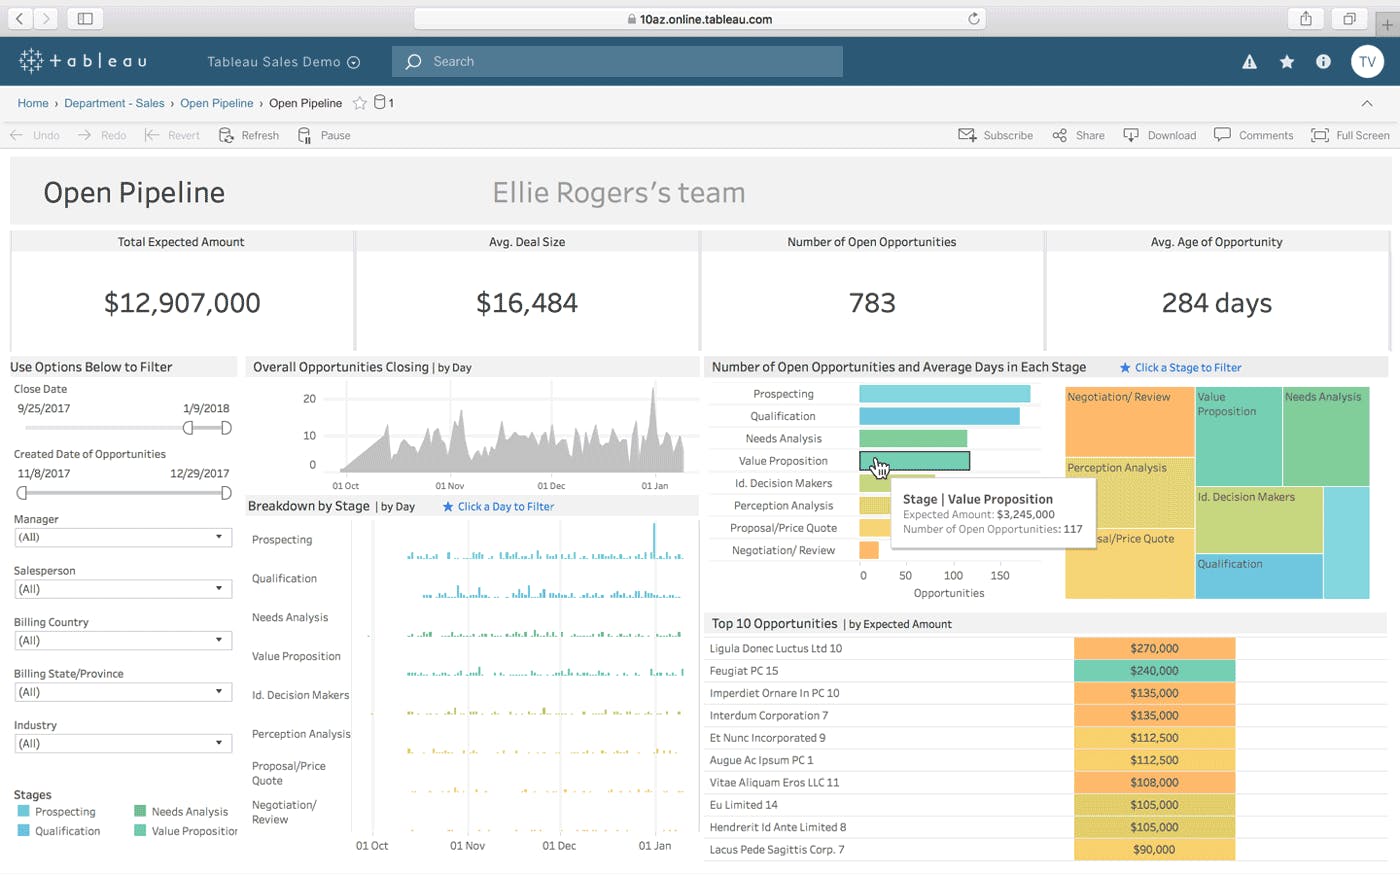
Pipeline Management
Having clear oversight of your sales team’s activities allows you to see at a glance how close you are to hitting those important targets. Incentivize and engage your team with a clear analysis of their activities, while managing the sales lifecycle of opportunities.
Cost Monitoring
Visualize masses of data in simple graphs to keep track of costs and spot opportunities to save.
Founders’ Insight
When it comes to sharing Business Information within any organization, there is a tension between the value of transparency and the need for security. A better informed workforce is a more productive workforce, and a more productive workforce directly impacts the bottom line. But opening the door to your company's most critical data will always be a compromise too far if it means that there is a danger that it could be open to abuse. When we looked at what others in the industry were doing and realized that it wasn't anywhere near what we would describe as 'secure', we knew we had to completely rethink the way data was handled for displaying on screens. ScreenCloud's Dashboard feature is the most secure solution available because anything less is simply not good enough for our customers who need to share their data and sleep at night.
Request a demo
ScreenCloud Secure Dashboards is one of the most secure, scalable and affordable options in the industry when it comes to putting your data up on screens and sharing it. Don't just take our word for it. Request a demo today.

Ready to get your organization connected?
Connect your first screen today with our 14-day free trial


